The purpose of operating such a monitoring system is to collect and collate large-scale measurements of peoples Internet connectivity. We believe a user should still gain some utility from running an measurement node in their home. Therefore we prioritised the development of a visual interface that non-expert users can use to monitor the behaviour of their connection.
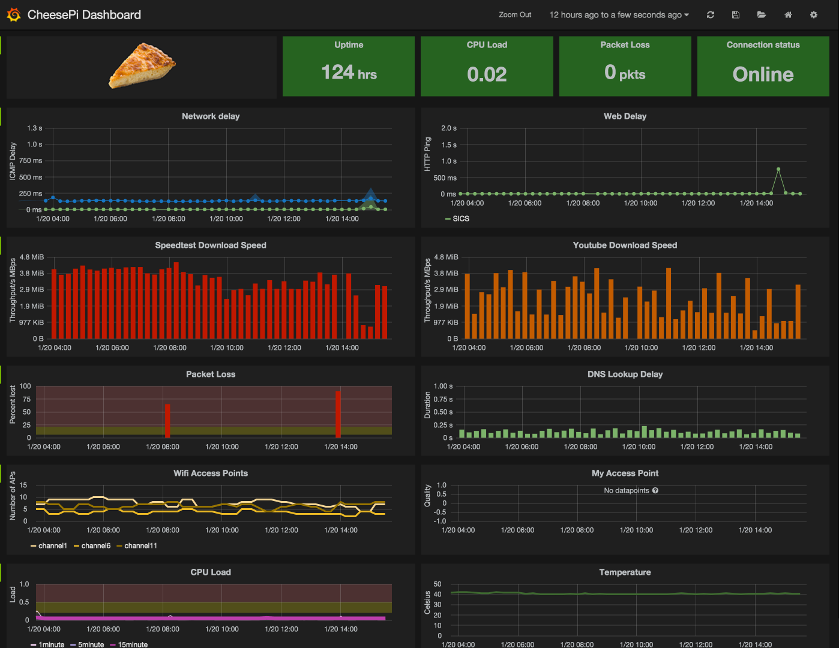
One of the easiest mediums for this is a website, locally hosted on the Raspberry Pi, that displays graphs and figures accessible via the users web browser on their access device. We plan to extend this interface with simple and expert modes. It is currently user-definable and can be configured through the website to show any combination or processing of stored data. This enables flexible and rapid prototyping of new aspects of interest.
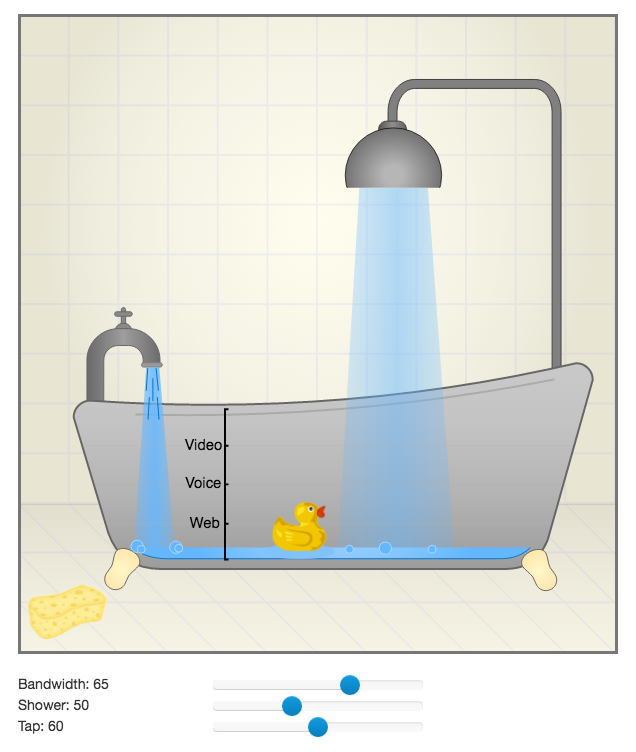
A non-technical version of the dashboard is being developed and a version of the trial version is below.